by Juan Inoriza
I. Introduction
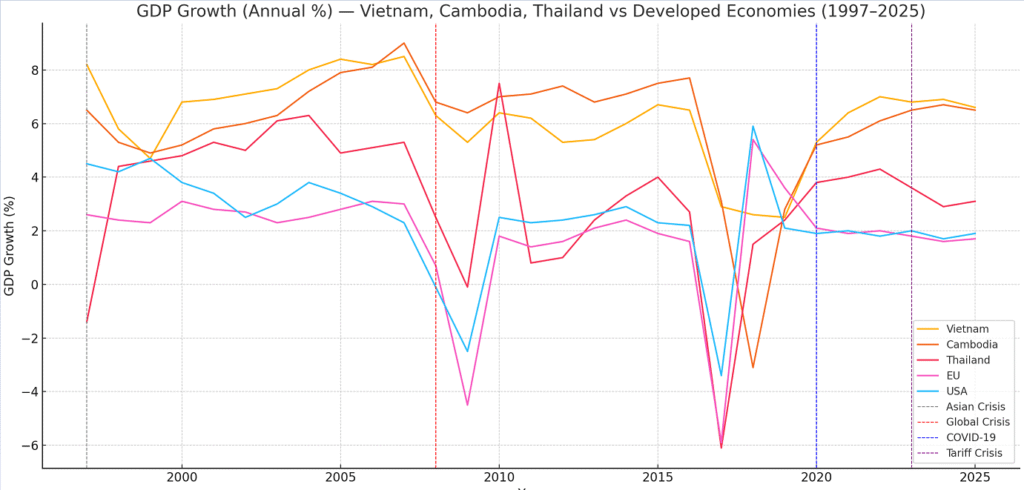
Over the past three decades, Southeast Asia has been subjected to a succession of profound economic shocks: the 1997 Asian Financial Crisis, the 2008 Global Financial Crisis, the COVID-19 pandemic, and, most recently, the ongoing trade and tariff tensions as of mid-2025. Vietnam, Cambodia, and Thailand, although geographically proximate and economically interconnected, have exhibited markedly distinct trajectories in terms of economic resilience, policy response, and long-term development.
This paper examines the evolution of these three economies in the context of recurring crises, assessing indicators such as GDP growth, per capita income, employment and unemployment rates, export-import volumes, and public debt. These trends are analysed comparatively alongside mature economies such as the European Union, Japan, South Korea, and the United States to shed light on both convergence and divergence in global economic patterns.
The study seeks to address the following research questions:
- How have Vietnam, Cambodia, and Thailand adapted to and recovered from each major crisis?
- What structural reforms, if any, contributed to resilience or vulnerability?
- How do their trajectories compare to those of advanced economies in similar timeframes?
By tracing these nations’ responses across multiple crises, this paper contributes to broader discussions on economic resilience, regional development, and the shifting dynamics of global trade and finance.
II. Methodology
This study adopts a comparative macroeconomic analysis approach, focusing on the three Southeast Asian economies, Vietnam, Cambodia, and Thailand, between 1997 and mid-2025. Data has been drawn from reputable international sources, including the International Monetary Fund (IMF), World Bank, Asian Development Bank (ADB), World Trade Organization (WTO), and respective national statistics agencies.
The analysis is structured around the following core indicators:
- Real GDP growth (annual %)
- GDP per capita (constant PPP international dollars)
- Unemployment and underemployment rates
- Volume and value of exports and imports
- Public debt as a percentage of GDP
- Structural transformation (agriculture–industry–services share in GDP)
Crisis periods have been demarcated based on their economic impact:
- 1997–1998: Asian Financial Crisis
- 2008–2009: Global Financial Crisis
- 2020–2022: COVID-19 Pandemic
- 2023–2025: Trade/Tariff Crisis and Reconfiguration of Global Value Chains
Comparative benchmarks include the European Union, Japan, South Korea, and the United States to assess convergence or divergence in recovery patterns, debt sustainability, and trade dependency.
In addition to quantitative data, the paper also includes qualitative policy reviews and institutional reform trajectories drawn from secondary literature and policy briefs.
III. The Asian Financial Crisis (1997–1998)
3.1 Background and Origins
The Asian Financial Crisis began in Thailand in July 1997 when the government floated the baht, triggering massive currency devaluations across the region. The crisis exposed structural vulnerabilities, such as excessive short-term foreign debt, weak banking supervision, and over‑valued exchange‑rate pegs. Before the crisis, Thailand’s foreign debt to GDP stood at roughly 100–167% in major ASEAN economies, rising beyond 180% during the crunch.
3.2 Impacts on Vietnam, Cambodia, and Thailand
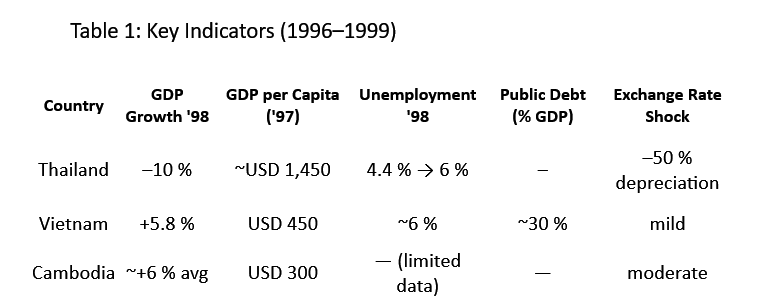
- Thailand: GDP plunged by nearly 10 % in 1998 and took over a decade to return to 1996 levels The baht depreciated from THB 25/USD to THB 56/USD; the SET index collapsed from ~1,753 to ~207. Unemployment rose from 1.5 % to 4.4 % between 1996 and 1998. The IMF provided USD 17.2 bn in funding; reforms included bank restructuring, fiscal tightening, and currency float regime.
- Vietnam: Although growth slowed from 8.2 % in 1997 to 5.8 % in 1998, Vietnam largely bypassed the crisis’s most severe effects. With a foreign‑exchange buffer and limited financial liberalisation, Vietnam maintained macroeconomic stability and a modest poverty reduction momentum.
- Cambodia: Pre-crisis GDP growth averaged ~6 % annually (1993–1996), and GNI per capita had doubled to ~USD 300 by 1997. The financial turmoil led to a sharp capital flight: FDI commitments dropped 45 % in 1997 and actual flows shrank by 41 %. Dollarisation provided some stability, yet inflation soared, household incomes were squeezed, and social outcomes deteriorated.
3.3 Policy Responses and Recovery
- Thailand implemented IMF-backed “bitter medicine”, fiscal austerity, interest rate hikes, bank recapitalisation, and structural reforms targeting private sector-led recovery.
- Vietnam, benefiting from post‑Đổi Mới macroprudential policies and cautious capital liberalisation, maintained growth, poverty alleviation, and social stability.
- Cambodia, constrained by fragile institutions and political unrest, recovered more slowly, though stabilisation was aided by the gradual resumption of investment and donor support.
While Thailand bore the epicentre of the crisis, experiencing deep recession, currency collapse, and a sluggish decade-long recovery, Vietnam’s robust policy base cushioned it, enabling sustained growth and socioeconomic progress. Cambodia, as an emerging, dollarized economy with governance weaknesses, endured significant shocks in capital and investment, which undermined its nascent recovery.
In comparison, advanced economies like Japan and South Korea also suffered but rebounded faster due to stronger institutional frameworks and deeper capital markets. This crisis underscored the pivotal role of macro-financial buffers, structural reforms, and governance in economic resilience.
IV. The Global Financial Crisis (2008–2009)
4.1 Pre‑crisis Context
- Vietnam experienced rapid growth (8–8.5 % annually) before 2008. High inflation (~23 % in 2008) and overheating prompted macro-prudential tightening.
- Cambodia, driven by garments and tourism, averaged ~9 % GDP growth from 2005–2007.
- Thailand saw growth of ~4–5 % per annum, but was already affected by political instability since 2006.
Advanced economies such as the EU, USA, Japan, and South Korea relied on consumption and financial sectors. The US mortgage collapse precipitated a global demand shock.
4.2 GDP and Trade Impact
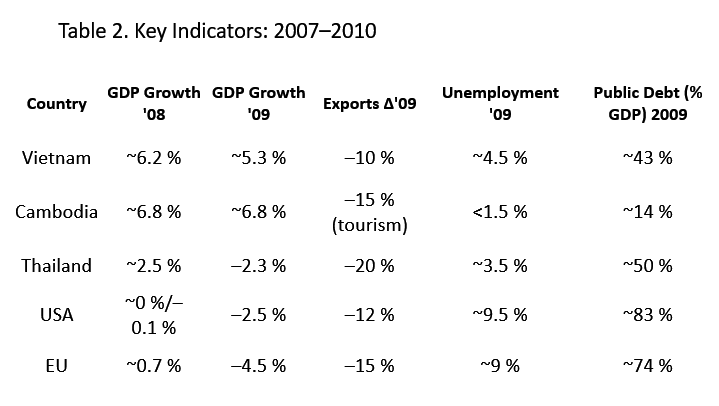
- Vietnam: Growth fell to ~5.3 % in 2009 versus ~8 % prior; exports contracted by ~10 % in 2009.
- Cambodia: GDP slowed to ~6.8 %, but growth remained positive; tourism receipts dropped ~20 % in 2009.
- Thailand: Shrunk ~2.3 % in 2009; exports dropped ~20 % YoY; unemployment rose from ~1.4 % to ~3.5 %.
- USA: Recession deepened; GDP fell ~2.5 % in 2009.
- EU: GDP declined ~4.5 % in 2009.
4.3 Employment Effects
- Vietnam: Unemployment rose modestly from ~3.3 % to ~4.5 %; underemployment in informal sectors persisted.
- Cambodia: Unemployment stayed low (<1.5 %), yet many garment workers faced reduced hours and wages.
- Thailand: Unemployment peaked ~3.5 %, more severe in manufacturing and construction.
4.4 Public Debt & Policy Response
- Vietnam adopted fiscal and monetary stimulus, increasing public debt from ~32 % of GDP in 2007 to ~43 % in 2009.
- Cambodia balanced between fiscal support and reliance on external donors, with public debt ~14 % of GDP.
- Thailand implemented fiscal stimulus, pushing debt from ~40 % to ~50 %.
- OECD economies implemented quantitative easing (US), large fiscal deficits (EU-to-Japan), and bailouts.
4.5 Comparative Recovery
- Vietnam: Quick rebound to ~6.4 % in 2010, powered by export revival and FDI.
- Cambodia: Growth rebounded to ~6.4 %; tourism and garments recovered by 2010.
- Thailand: Recovery slower; reached 7.5 % growth in 2010, but volatility returned in 2011–12 due to politics.
- Vietnam demonstrated notable resilience, thanks to pre-crisis buffers and policy agility.
- Cambodia weathered disruptions via garment and tourism dependency, aided by external support.
- Thailand was among the hardest hit regionally, with deeper GDP contraction and slower recovery.
- In contrast, advanced economies faced severe financial and household sector strain but were able to deploy large-scale fiscal/monetary countershock.
V. The COVID‑19 Pandemic (2020–2022)
5.1 Economic Contraction and Recovery
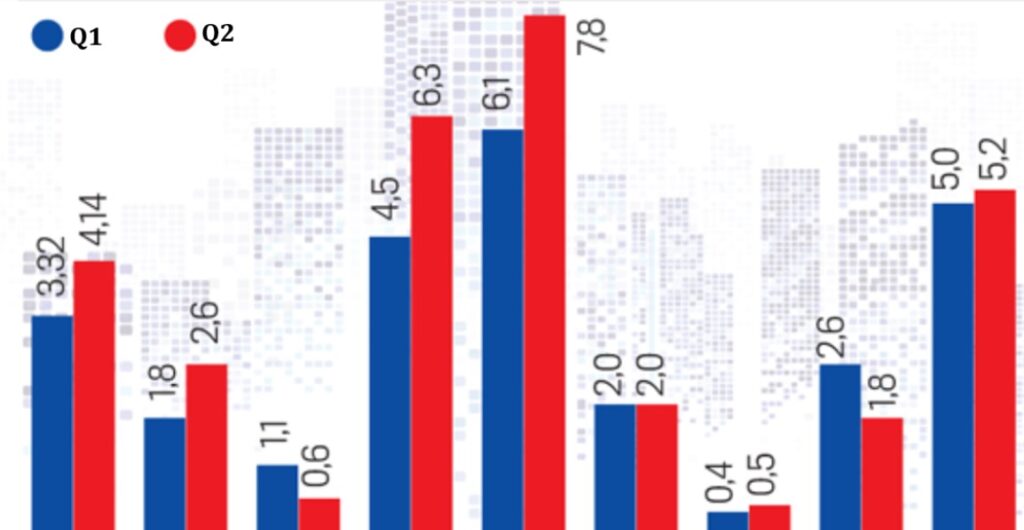
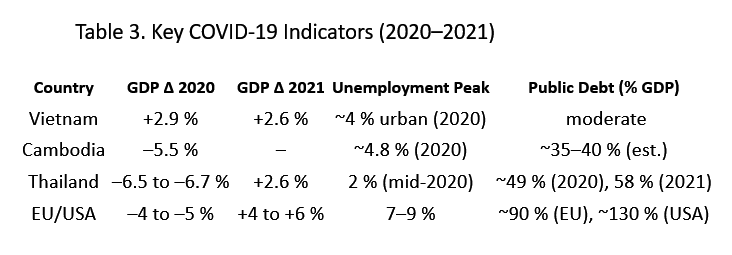
- Vietnam: Vietnam recorded GDP growth of 2.91 % in 2020, one of the highest rates globally that year. The fourth-quarter rebound was notable at 4.48 %. Despite border closures, industrial exports and agricultural output supported this resilience. In 2021, growth slowed to 2.58 % due to Delta-wave lockdowns.
- Cambodia: With tourism and garment sectors contributing ~70 % of GDP and nearly 40 % of jobs, Cambodia suffered heavily. GDP contracted by 5.5 % in 2020, with tourism revenue losses of USD 3 billion and unemployment rising to 4.8 %.
- Thailand: According to the World Bank, Thailand’s GDP plunged by around 6.5–6.7 % in 2020. Unemployment doubled to 2 %, with approximately 700,000 jobs lost by Q2 2020. Fiscal deficit widened to 5.9 % of GDP, with debt spiking to ~49 %.
5.2 Labour Market Impacts
- Vietnam: Over 30 million workers were affected,2.5 million jobs lost at the Q2 2020 trough, labour participation declined 4 %, unemployment surged by ~22 %, and underemployment was over 50 %. By Q4, unemployment hovered at 2.48 % overall, and 3.68 % in cities, the highest in a decade.
- Cambodia: Some 390,000 jobs were lost overall, with at least 100,000 garment workers laid off. Tourism closures forced 10,000+ workers into unemployment, and around 45,000 hospitality jobs were lost.
- Thailand: Job losses were widespread: 700,000 fewer jobs by mid-2020, unemployment doubled, and youth/unskilled workers were hit hardest in tourism and retail.
5.3 Public Debt and Fiscal Response
- Vietnam: Adopted targeted lockdowns and social support but maintained budget discipline. While precise borrowing data is limited, Vietnam’s pre-pandemic buffers and controlled debt expansion helped avoid excessive debt burdens.
- Cambodia: Lacked fiscal space and relied heavily on external aid. Public debt remained moderate (~30–40 % GDP) but direct figures vary due to limited transparency and donor dependence.
- Thailand: Debt rose from ~41 % to 49.4 % in 2020, then 58.4 % in 2021, with deficit reaching 7.4 %. Most debt was local-currency, medium–long term.
5.4 Sectoral Adjustment & Policy Measures
- Vietnam: Maintained industrial production and agricultural output; the service sector shrank by only 1.76 % in Q2 2020. Later waves in 2021 caused contraction (Q3: –6.17 %). Policy approach focused on minimal lockdowns and a strong export push via FTAs with EU and others.
- Cambodia: Tourist flows collapsed by ~65 % in early 2020; hotel closures exceeded 600, garment exports stagnated, and ~2,956 businesses shut temporarily.
- Thailand: Tourism (20 % GDP) froze; mitigation included a ~THB 1 trillion package with cash transfers and medical support, though disbursement was sluggish. The second wave triggered political protests.
5.5 Comparison with Advanced Economies
- EU, USA, Japan, South Korea: Utilised large-scale fiscal stimulus and monetary easing (e.g., US quantitative easing, EU NextGenerationEU funds), suffering GDP contractions of 4–5 % but recovering by 2021–2022.
- South Korea & Japan: Showed modest contractions (OECD avg ~2–3 %) with robust public health infrastructures and extensive employment support programmes.
The Southeast Asian economies experienced more severe contractions but also faster rebounds, particularly in export-reliant sectors. Their debt-to-GDP ratios remained below those of advanced economies (EU ~90 %, USA ~130 %).
Vietnam exhibited remarkable resilience, maintaining positive growth and containing unemployment despite heavy labour-market disruptions. Cambodia was hard hit, especially through tourism and garment exports, with high unemployment and reliance on external aid. Thailand suffered a deeper contraction, with recovery hindered by tourism dependence and political instability.
All three maintained public debt levels below advanced economies, but with rising debt ratios due to pandemic stimulus. Structural vulnerabilities, including reliance on external sectors and informal labour, remain key legacy issues.
VI. The Post‑Pandemic and Tariff Crisis (2023–2025)
6.1 Escalating Protectionism and Global Trade Shifts
In early 2025, the United States imposed broad “reciprocal tariffs” on ASEAN countries, with tariffs ranging from 46 % for Vietnam, 49 % for Cambodia, and 36 % for Thailand. The aim was to punish perceived trade imbalances and redress unfair practices. Vietnam’s GDP growth forecast was subsequently down‑revised by 1 percentage point, and Thailand’s by 0.8 pp.
Malaysia, holding the ASEAN chair at the time, secured a 90‑day pause, during which ASEAN aimed to coordinate diplomatic responses, including intra‑ASEAN trade facilitation and outreach to the WTO.
Simultaneously, the expiration of a U.S. tariff waiver on solar panels (mid‑2024) led Chinese-owned manufacturers to halt production in Vietnam and Thailand. Reuters reported exports from these countries to the U.S. plunged by 33 % over nine months.
6.2 Vietnam: Pivoting with China+1 and FDI Diversification
Vietnam has become a linchpin in the “China+1” strategy. In early 2025 alone, firms like SMC Corporation began scaling up manufacturing in Vietnam, shifting directly from Chinese operations. Meanwhile, Chinese FDI is transitioning toward high-tech and green industries, including semiconductors, EVs, and renewable energy, with major projects in Thai Binh and Thai Nguyen.
By 2024–2025, Chinese-backed investments accounted for nearly 30 % of new FDI projects in Vietnam; Singapore and South Korea also featured prominently. Vietnam’s resilient performance,7.1 % GDP growth in 2024,has positioned it as ASEAN’s fastest-growing economy.
However, rising U.S. tariffs on Vietnamese exports (up to 46 %) remain a serious external risk. In response, Vietnam negotiated a 90-day tariff pause, pledged to lower its tariffs, and increased U.S. imports,all measures to mitigate escalation.
6.3 Cambodia: Upgrading amid Headwinds
Cambodia has emerged as a beneficiary of U.S. firms relocating production from China: a U.S. lighting company moved 70 % of its output to Cambodia in 2024. However, this shift has also made Cambodia vulnerable to U.S. scrutiny over “Chinese transhipment,” amid high dependence on Chinese capital (50%+), infrastructure financed under BRI, and a looming trade deficit with China.
Following the U.S. tariff regime, Cambodia’s exports contracted by –9.2 % in 2025, with key sectors like textiles, footwear, and wooden products hit hardest; FDI inflows are also projected to decline. In response, Phnom Penh is exploring CPTPP accession under a push to join higher-value global value chains.
6.4 Thailand: Political Gridlock and Economic Stagnation
Thailand has experienced political turbulence since mid-2025, including border tensions with Cambodia that disrupted investor sentiment and capital inflows. The U.S. tariffs compounded economic pressure, pushing Thailand to slow GDP growth forecasts and prompting ASEAN-wide diplomatic coordination.
With limited progress on reforms and productivity, Thailand risked being bypassed in the China+1 supply chain realignment, unlike Vietnam and Cambodia.
6.5 Trade Dynamics Amid Changing Global Rules
- Vietnam: Export volumes to the U.S. declined sharply after the solar tariff waiver ended, but robust electronics and textiles exports persisted. Its dominant trade surplus (~USD 123 bn with the U.S.) flags ongoing tariff risk.
- Cambodia: Suffered a GDP drop in export value by about 5.3 % in 2025 projections, with downstream sectors particularly.
- Thailand: Export demand weakened as U.S. importers shifted purchases to less-tariffed regional suppliers; however, Thailand continued supplying China and ASEAN markets.
In parallel, advanced economies, especially the U.S., actively reshored manufacturing, while Europe and China pursued new FTAs and green energy markets, reshaping global supply chains in ways that disadvantage ASEAN’s export-oriented economies.
6.6 ASEAN’s Response and Strategic Outlook
ASEAN responded by coordinating diplomatically. Malaysia, as chair, led discussions with Washington, while a common stance was forged at the ASEAN summit. ASEAN has emphasised the need to diversify trade, accelerate RCEP integration, and strengthen its WTO advocacy.
Furthermore, ASEAN nations are increasingly redirecting foreign investment toward intra-regional projects, digital economies, and green infrastructure, ambitions buoyed by Vietnam’s industrial leadership and Cambodia’s CPTPP candidature.
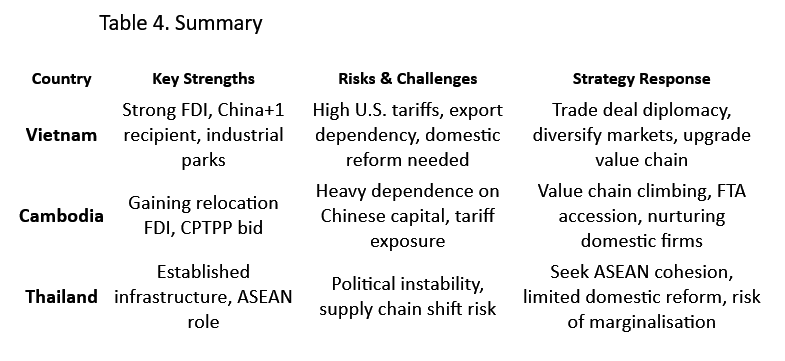
Vietnam leads the regional response, rapidly pivoting production, diversifying FDI, and aggressively engaging diplomatically. Cambodia is leveraging its low wages and trade openness to attract investment while planning structural integration via CPTPP. Meanwhile, Thailand’s political gridlock and weaker reform momentum risk undermining its supply-chain standing.
ASEAN’s collective challenge will be to adapt to a fragmented trading environment, balancing responses to protectionism with internal integration and movement into advanced sectors.
VII. Macroeconomic Trajectories and Structural Shifts
7.1 GDP and Per Capita Income Evolution
From flatlining at roughly USD 350 in 1997, Vietnam’s GDP per capita surged to ~USD 4,316 in 2023, with projections reaching USD 4,806 by 2025. This fivefold rise reflects the sustained impact of economic reform and export-led growth. Cambodia, though starting lower, reached USD 1,771 in 2022, and Thailand achieved USD 7,631 in the same year.
By contrast, advanced economies showed markedly higher GDP per capita: roughly USD 38,000 for the EU, and USD 75,000+ for the USA, highlighting that Southeast Asia remains on a lower rung of income levels despite rapid growth.
Growth rates tell a deeper story: Vietnam’s per capita income rose by 7% in 2022 and 4.3% in 2023, up from just 1.9% in 2020, underscoring its dynamic recovery post-COVID.
7.2 Employment, Informal Sector, Youth Unemployment
- Vietnam: Unemployment remained low (~2–3%), but underemployment and temporary lay-offs affected over 30 million in 2020. Youth unemployment, especially among recent graduates, remains a structural challenge, with sizeable informal-sector participation.
- Cambodia: Informal employment accounts for 60–70% of the workforce. Youth unemployment is estimated at 11–13%, particularly in rural areas, with the garment and tourism sectors showing vulnerability.
- Thailand: Official unemployment hovered around 2–3%, but the informal sector employs more than 50% of non-agricultural workers. Youth unemployment, at 8–10%, remains significantly higher than overall rates.
These dynamics contrast with advanced economies where unemployment in 2020–21 rose to 7–9% in the EU and US, but strong welfare systems mitigated household shocks.
7.3 External Trade Dependence vs Internal Market Development
All three ASEAN countries are highly integrated in global trade:
- Vietnam: Exhibits one of the world’s largest trade-to-GDP ratios (>200%), with exports heavily skewed to electronics and textiles destined for the U.S. and EU.
- Cambodia: Garment and footwear exports remain crucial (~50% of total exports). Exports to the U.S. comprise ~20% of GDP, and dependence on Chinese investment and supply chains is acute.
- Thailand: Balanced between exports (~60% of GDP) in automotive and electronics and robust domestic consumption.
While imports surged after 2020, domestic market development remains limited; manufacturing and services value‑addition are increasing, but internal demand will be key for future resilience.
Advanced economies rely less on merchandise exports (~30–40% of GDP) and more on services and domestic consumption, which cushions against trade shocks.
7.4 Debt Sustainability and Fiscal Space Across Crises
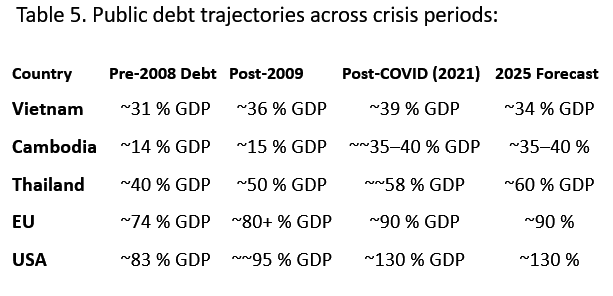
Vietnam remains the most fiscally conservative among the trio, with debt-to-GDP falling post-2023, reflecting buffer usage and limited fiscal injections. Cambodia’s debt is rising, but still moderate. Thailand’s public debt has surged over crises, nearing levels seen in developed economies.
Advanced economies maintain the highest debt levels but benefit from deep capital markets and reserve currency status, providing fiscal flexibility absent in emerging economies.
- Vietnam has undergone transformative structural change,from extreme poverty (~$350 per capita) to a lower-middle income economy approaching $5,000 per person, but retains low unemployment amid significant informal and youth job challenges.
- Cambodia, though posting rapid relative gains, still significantly trails peers, with weak formal employment and rising debt.
- Thailand has achieved middle-income status (~$7,600 per person), underpinned by established institutions and consumption, yet hampered by political uncertainty and public debt accumulation.
- External trade remains a critical driver of growth, yet reliance is risky; internal market deepening and value‑chain upgradation are essential.
- Fiscal space varies: Vietnam’s prudent debt ratios suggest resilience, Cambodia’s moderate debt is manageable, while Thailand and developed economies are pushing debt levels closer to unsustainable thresholds without loss of investor confidence.
Table 6: GDP Growth (Annual % – Vietnam, Cambodia, and Thailand vs Developed Economies Through Successive Global Crises (1997–2025)
VIII. Comparative Lessons and Regional Implications
8.1 Deepening Structural Reforms for Crisis Resilience
The ASEAN+3 Regional Economic Outlook underscores that economies with diversified, inclusive reforms, including robust bond markets, macroprudential frameworks, and flexible exchange rates, exhibited superior resilience to shocks. The IMF similarly argues that “ambitious economy-wide structural reforms… foster diversified, broad-based, inclusive growth”. Across 1997–2025, the capacity to reform institutions has proven crucial.
- Vietnam’s cautious yet consistent reforms, progressing from Đổi Mới to macroprudential calibration, have supported steady growth and crisis absorption.
- Cambodia’s reform trajectory has faltered due to governance and institutional fragility, despite capitalising on tariff-based industrial relocation in 2024–25.
- Thailand boasts established institutions yet struggles to reform amid political gridlock, undermining investor confidence and growth outlook.
8.2 Export-Centric Vulnerabilities & Value-Chain Opportunities
High trade-to-GDP ratios have been a double-edged sword, fuel for growth, but a conduit for crisis transmission:
- Vietnam thrived under export-led expansion but now confronts U.S. tariffs of 46%, prompting diplomatic efforts and trade diversification.
- Cambodia successfully attracted U.S. firms migrating from China (e.g., Lucidity Lights), but faces risks related to “Chinese trans-shipment” scrutiny.
- Thailand remains a manufacturing powerhouse, yet growth projections, now just 1.8% for 2025, are hampered by sagging exports and tourism.
To mitigate vulnerability, ASEAN countries must climb up the value chain, investing in digital capacity, green infrastructure, and innovation-driven manufacturing, as the IMF suggests.
8.3 Balancing External Exposure & Internal Market Development
Developed economies rely more on domestic services and consumer markets (~30–40% exports of GDP), affording greater shock absorption. In contrast:
- Southeast Asia, especially Vietnam and Cambodia, remains heavily export-dependent (>100% trade-to-GDP), making domestic market deepening essential for resilience.
- Boosting intra-ASEAN trade, infrastructure integration, and service-sector job creation can help build robust insulation, echoing ASEAN’s long-standing “ASEAN Way” of economic cooperation.
8.4 Restoring Fiscal Space & Debt Management
Fiscal buffers have been key to navigating successive shocks:
- Vietnam’s public debt remains low (~34% of GDP), allowing countercyclical space.
- Cambodia’s debt, although rising, remains within manageable bounds.
- Thailand’s ratio (~60%) mirrors advanced economies, limiting fiscal options amid political and policy uncertainty.
As OECD-level debt becomes the norm, maintaining market access and policy credibility through prudent fiscal frameworks remains vital.
8.5 Policy Coordination & Geopolitical Balancing
Vietnam’s recent U.S. trade deal, though complex, illustrates the necessity of navigating U.S.–China tensions without severing ties. ASEAN’s coordinated diplomatic posture, aided by Malaysia’s 90-day tariff pause initiative, reflects greater sophistication in external diplomacy.
Amid global stress, e.g., future “China shocks”, ASEAN must synchronise monetary and fiscal policy interventions, as exemplified by central bank flexibility in Thailand. The IMF also stresses deeper regional financial integration and institutional synergies.
8.6 Summary of Comparative Lessons
- Reform consistency is fundamental, Vietnam’s market openness and macroprudential evolution have delivered steady resilience.
- Export dependence necessitates diversification, but requires upgrading within global value chains.
- Domestic market expansion via infrastructure, services and intra-regional integration will reinforce shock absorption.
- Fiscal discipline maintains policy leverage; rising debt in Thailand calls for renewed caution.
- Coordinated diplomacy and multilateralism, including postures on trade and geopolitical tensions, are now strategic imperatives.
ASEAN’s future resilience hinges on translating lessons from past crises into forward-looking integration, innovation-driven growth, and balanced global engagement.
IX. Conclusion
This longitudinal analysis of Vietnam, Cambodia, and Thailand across four successive crises, from the 1997 Asian Financial Crisis through the 2008 Global Financial Crisis, the COVID-19 pandemic, and most recently the post-pandemic tariff shock (2023–2025), reveals compelling insights:
1. Resilience Through Structural Reform
Vietnam stands out as the model of consistency. Successive phases of Đổi Mới, macroprudential regulation, and digitalisation have underpinned sustained growth and modest debt accumulation. This approach has allowed it to weather each crisis more adeptly than Cambodia and Thailand.
2. Export-Driven Growth Necessitates Diversification
All three nations display high trade-to-GDP ratios, making them vulnerable to external shockwaves. The recent U.S. tariffs, imposed at up to 49 %, underscore the risks of such dependency. Vietnam and Cambodia were especially affected, as documented in FT and Reuters coverage. Moving up the global value chain and diversifying export destinations are now critical.
3. Importance of Domestic Demand
Unlike advanced economies, which derive much of their GDP from services and internal consumption, these Southeast Asian countries still rely heavily on exports. The IMF stresses that strengthening domestic markets, through services, social protection, and investment, is key to absorbing future shocks.
4. Preserving Fiscal Space
Vietnam’s conservative debt trajectory (~34% of GDP) has afforded countercyclical flexibility. Cambodia, while debt rising, remains within manageable thresholds. In contrast, Thailand now mirrors advanced-economy debt levels (~60%), raising questions about fiscal resilience.
5. Diplomacy in a Geopolitically Charged Era
The recent tariff pause initiated by former U.S. President Trump highlights the complex geopolitical pressure on ASEAN economies. Vietnam’s balancing act, managing trade deals with both the U.S. and China, illustrates the nuanced diplomacy required to protect economic openness without courting unwanted alignment pressures.
Policy Implications
- Pursue bold, economy-wide reforms that promote governance, digital capacity, and financial inclusion.
- Accelerate value-chain upgradation in manufacturing and services to reduce tariff vulnerability.
- Expand domestic demand through welfare systems, financial resilience, and human capital development.
- Maintain prudent fiscal policies, particularly for Thailand, to ensure room for manoeuvre in future crises.
- Strengthen regional diplomacy and integration, leveraging ASEAN unity and strategic partnership frameworks to navigate geopolitical complexity.
Final Reflection
The trajectories of Vietnam, Cambodia, and Thailand from 1997 to mid-2025 demonstrate that resilience is not random, but built. Vietnam’s steadfast modernisation strategy, Cambodia’s emergent dynamism, and Thailand’s structural strengths, despite political fragilities, each offer instructive examples. The region’s collective challenge now is to translate past lessons into forward-thinking policies, combining structural reform, economic diversification, social protection, and strategic diplomacy to reinforce Southeast Asia’s role as an integrated, resilient, and globally-oriented economic bloc.
References:
Asian Development Bank (2025, April). ASEAN+3 Regional Economic Outlook 2025 [PDF]. Manila
International Monetary Fund. (2024, April). World Economic Outlook Database [Data set].
International Monetary Fund. (2025). Cambodia: 2024 Article IV Consultation—Staff Report [PDF].
Macrotrends LLC. (n.d.). Vietnam GDP per capita, 1960–2023. Macrotrends.
United Nations Statistics Division. (n.d.). Per capita GDP at current prices – US dollars – Viet Nam [Data set]. UNdata.
Wikipedia contributors. (2025, June 2025). Đổi Mới. In Wikipedia, The Free Encyclopedia. Retrieved from https://en.wikipedia.org/wiki/Đổi_Mới
Wikipedia contributors. (2025, June 2025). Economy of Cambodia. In Wikipedia, The Free Encyclopedia. Retrieved from https://en.wikipedia.org/wiki/Economy_of_Cambodia
Wikipedia contributors. (2025, June 2025). Economy of Thailand. In Wikipedia, The Free Encyclopedia. Retrieved from https://en.wikipedia.org/wiki/Economy_of_Thailand
Wikipedia contributors. (2025, June 2025). Economy of Vietnam. In Wikipedia, The Free Encyclopedia. Retrieved from https://en.wikipedia.org/wiki/Economy_of_Vietnam
World Bank. (2024). The World Bank in Cambodia: Overview. Retrieved from https://www.worldbank.org/en/country/cambodia/overview
World Bank. (n.d.). GDP per capita (current US$) – Vietnam [Data set]. World Development Indicators. Retrieved from https://data.worldbank.org/indicator/NY.GDP.PCAP.CD?locations=VN